
Wednesday, August 12, 2015


Understanding Candlestick Patterns
What makes candlestick charts so popular is that a trader is able to gain critical market information almost immediately. You can check the movement of the price of the asset just by glancing at the chart. You can see the opening price, high price, low price and closing price of the asset for a particular time interval. This is why candlestick charts are sometimes called OHLC charts.
The movements indicated by each candlestick are movements in short intervals of time and these movements fall in the category of primary movements in the market.
There is another category of movement called secondary movements in the market. For instance, if you observe the day to day movement of the market price for any give asset for a year you will notice an oscillating pattern in the movement. Candlestick charting does a very good job of showing these oscillations on almost any interval of time. That is what makes candlestick charting such a powerful tool for predicting the movement of the price of the assets in the market.
Over the years traders have observed some of these oscillating patterns to develop dozens of strategies to maximize their profits. Here are some of the basic patterns to look for during trading.

The movements indicated by each candlestick are movements in short intervals of time and these movements fall in the category of primary movements in the market.
There is another category of movement called secondary movements in the market. For instance, if you observe the day to day movement of the market price for any give asset for a year you will notice an oscillating pattern in the movement. Candlestick charting does a very good job of showing these oscillations on almost any interval of time. That is what makes candlestick charting such a powerful tool for predicting the movement of the price of the assets in the market.
Over the years traders have observed some of these oscillating patterns to develop dozens of strategies to maximize their profits. Here are some of the basic patterns to look for during trading.
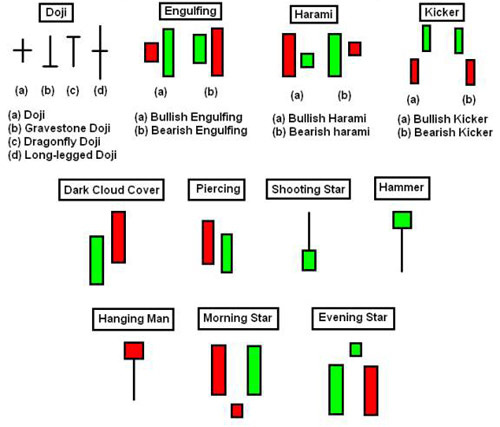
As you can see, there is a lot to learn about trading in the market, but with time and practice these patterns will familiar to you. Once you develop an understanding of the predictive nature of these patterns you will be able to use them to your advantage in binary options trading and put the odds in your favor. I will go in more depth in these patterns and others in future postings.
Tuesday, August 11, 2015
Binary Options Trading Dictionary
Asset/Underlying Asset
Asset is the type of item that you are trading. This the asset in which you are purchasing an option against such as; currencies, commodities, indices and stocks.
At the Money/On the Money
This is the position in which the option is in when it expires neither "in-the-money" or "out-of-the-money" but at the same price in which it was purchased. Your invested amount is refunded to you when this happens. There is no profit or loss.
Bearish Market
The term is used to describe the condition of a financial market or stock who's price is trending downward.
Binary Options
Also called digital options, or all-or-nothing options, are contracts which have only two possible outcomes - either they win or they lose. A binary option involves a fixed payout after the asset meets or exceeds its predetermined strike price. Values of binary options payouts are determined at start of the contract and aren't affected by the magnitude of the movement of the asset value. Binary call options pay the predetermined amount providing the price of the asset exceeds the strike price at expiration. Similar, binary put options pay the predetermined price if the price of the asset is trading less than the option strike price at expiration.
Boundary/Range Instrument
A boundary or range instrument is an option that allows a trader to decide whether the price if the asset when the option expires will be inside or outside a specified range.
Broker
In binary options trading a broker is the web-based interface where traders make a contract to purchase options.
Bullish Market
The term is used to describe the condition of a financial market or stock who's price is trending upward.
Call Options /High Options
This the choice a binary iotions trader choose if he predicts that the value of the item he is trading at will increase in price by the time of his chosen expiration. If the strike price increases in that time, you earn money based on the percentage set prior to bidding.
Commodities
A commodity is usually a physical item like Oil, Sugar, Gold, Silver, Wheat and Cotton and the price of these is determined by economic factors.
Currency
Currencies are traded in pairs and common examples of these are: USD/GBP, USD/EUR, USD/CAD and many more. The EUR/USD currency pair is the most popular asset traded in binary options trading. Other currency pairs that do not have the USD paired with them are called cross-currency pairs.
Current Price/Msrket Price
This is the current price of the underlying asset which is reported in “real time” without delay typically by a data provider. Some brokers report results that can be delayed and this is often mention in their terms and conditions.
Deposit
Before you can start trading you need to add funds to your trading accounteven though you can join and refister to them for free. This adding of funds is called a deposit. Different brokers offer varying minimum deposits anywhere from $100 up to around $500. The most common minimum amount is $200.
Early Closure
Early closure is where a trader has the ability to close an option and immediately ending the contract to prevent further losses of their investment. All brokers do not have this feature.
Expiry Time
This is the time and date at which the option you have purchased will expire and the trading stops. With binary options, expiry times are shorter than traditional investments and can be any of the following, 60 seconds, 2min, 5min, 10min, 15min, 30min, 45min, 1hr, 24 hr and weekly. the 10min and 15min expiry time are the most popular in binary options trading.
Index Option
Index Binary is an option whose underlying asset is that of an index. These can include such assets as: FTSE-100, Dow Jones, Nasdaq-100 and many more.
Instrument/Financial Instrument
Another name used for underlying asset.
In the Money
This term refers to the point when a purchased option ends as a gain and the trader makes a profit. An option is in-the-money if you place a "Call" option and the options price expires above the target price. If a "Put" option is placed then you are in-the-money when the options price expires below the target price.
One Touch Option
A one touch option is where you predict whether the underlying assets value will reach a target value when the option expires. If it does reach the target value then you are 'in-the-money' otherwise you fall short and are "out-of-the-money".
Out of the Money
This is basically the opposite of "In the Money".This term refers to the point when a purchased option has no gain and the trader makes a loss on their investment. An option is out-of-the-money if you place a "Call" on the option and the options price expires below the target price. If a "Put" option is placed then you are out-of-the-money when the options price expires above the target price.
Put Options/Low Options
This the choice a binary iotions trader choose if he predicts that the value of the item he is trading at will decrease in price by the time of his chosen expiration. If the strike price decreases in that time, you earn money based on the percentage set prior to bidding.
Stock
A stock is the stock of a specific company which are available to trade on the financial stock market. Examples of stock include: Apple Inc, Google Inc, Facebook, BP, Barclays and Vodafone.
Strike Price
Sometimes called the target or purchase price. It is the price of the underlying asset at the time at which you purchase the option. When the option expires, the new price of the underlying asset at the time of expiry is compared to the strike price to determine whether you have made a profit from your option your or lost your investment.
How To Read Candlestick Charts
Binary options traders often do technical analysis with charts to find patterns in the movement of the price of assets. These analyses can improve their odds of making a profit in the long run. Before you can do this you first must understand what the charts are telling you about the market, both in real-time after the market closes. One of the most popular chart type used in the market is the Japanese candlestick chart. These little candlesticks can tell you a lot about what is going on in the market in a specific time interval once you understand how to read them.
The chart below is a typical candlestick chart. It includes all the standard information about the market at that time interval, the opening price, the closing price, the highest and lowest price for that time interval and was the asset price trending downward or upward. These charts are sometimes called OHLC charts since they show the opening price, the high price, the low price and closing price for a time interval.This is the beginning steps of technical analysis.
The chart below is a typical candlestick chart. It includes all the standard information about the market at that time interval, the opening price, the closing price, the highest and lowest price for that time interval and was the asset price trending downward or upward. These charts are sometimes called OHLC charts since they show the opening price, the high price, the low price and closing price for a time interval.This is the beginning steps of technical analysis.

A Little History
Technical analysis by using candlesticks were first used by the Japanese in the 1600s to analyze the price of rice without doing any calculations. The first general use of the candle stick method for tracking prices was done by a Japanese rice trader named Homma Munehisa in 1750, in Sakata, Japan. Today this method of analysis is sometimes called "Sakata's Rules" or "Sakata's Methods". Charles Dow is credited for employing the use of the candlestick charting in the U.S. financial market during the early days of the Dow Jones Industrial Market in the 1900s.
The Anatomy of the Candlestick
As shown in the illustration below, a candlestick is a three component figure with a wick on top of the main body and wick attached below the main body. The body of candle is either green (white in a black & white image) or red (black in a black & white image).
The candle is green when the opening rate is lower than the closing rate and red when the opening rate is higher than the closing rate.
When the candle is green the top of the main body represents the closing rate and the bottom of the body represents the opening rate.
When the candle is red the top of the main body represents the opening rate and the bottom of the body represents the closing rate.
The end of the wicks extending from the top and bottom of the main body is the highest and lowest rate for that time interval.

The Anatomy of the Candlestick
As shown in the illustration below, a candlestick is a three component figure with a wick on top of the main body and wick attached below the main body. The body of candle is either green (white in a black & white image) or red (black in a black & white image).
The candle is green when the opening rate is lower than the closing rate and red when the opening rate is higher than the closing rate.
When the candle is green the top of the main body represents the closing rate and the bottom of the body represents the opening rate.
When the candle is red the top of the main body represents the opening rate and the bottom of the body represents the closing rate.
The end of the wicks extending from the top and bottom of the main body is the highest and lowest rate for that time interval.
The chart below is a candlestick chart where each candle represents the price movement for 15-minute intervals. You can change the time interval for your chart to your preference. For instance, if you change this to a one-minute interval then each candle would represent the price movement for a one-minute interval.
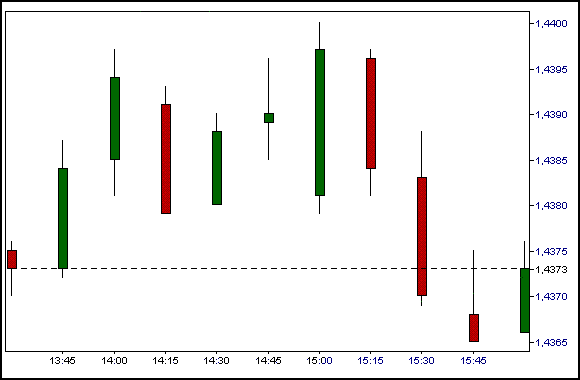 |
| A 15-minute interval candlestick chart |
The Main Trading Options Available in Binary Trade Options
- binary option (currency)
- pair
- long term
- 60 seconds
- one touch
- ladder
- follow
When a trader start contract or open a position he simply picks one of these call or put options, select his investment amount and select whether this trade will be a "call", predicting the price will go up or a "put", predicting the price will go down when the trade reach its expiry date.
Binary option or currency
Currency or binary option as I mentioned in another post is the most popular option for binary options trading. Uki just choose a currency pair to watch and determine whether it will go up or down from its strike price or stating price when the chosen timeframe ends. If your prediction is correct sand you invested $25, a potential payout of 81% of your investment will be paid to you, a payout amount of $45.25. A profit of $20.25.
Pair
Pair is a binary option where two assets are paired together such as Apple versus Google or Gold versus Silver. The goal here is to predict which asset in the pair will do better in the specified timeframe. In this case, the timeframe generally ends at the end of the day.
Long term
Long term options are simply call or put options that have longer expiry dates, usually one week, a month, several months or a year.
60 seconds
The 60 second option is the least popular in binary options trading. If you are not careful here you could lose all your money very quickly. This basically gambling when you use this option. However you can improve your odds of winning if you execute this option on a rapidly increasing or decreasing price trend when they occur. You can make a quick profit in a short period of time if you know what you are doing. You van also do 30-second, 2-minute, 3-minute and 5-minute expiry date under this option.
One-touch
The one-touch option is a longer term option. The idea here is to predict if the price of the asset will touch a predefined price in a specified timeframe. The predefined price can be higher or lower than the starting price. If your prediction is correction you can earn a potential payout of up 500% of your invested amount. You $25 investment can become a $125 payout, a profit of $100.
The Ladder
The ladder option as the name implies is an option where you have five price levels to choose from. With this option you have to predict how fair up or down the price of the currency will go. The price is predefined to go up or down/ Each level has a different potential payout amount and during trading the potential amount are constantly changing depending on what the market is doing. Potential payout can go as high as 600% of your invested amount.
Follow
The follow option is a good option for beginners, especially if they still are nervous about binary options trading. The trader simply make a selection of which of the top 10 traders in the platform to follow. You simply follow his actions and it is done automatically by the platform. You just set your investment amount and how long you wish to follow him. It can be a day, week, a month or a year. These guys are usually right close to 80% of the time. You will make a profit here by being patient and consistent with your decisions.
Getting Started in Binary Options Trading
When you are finally ready to do your first real trading online all you need to do is add funds to your account if you are already registered to a broker that you are comfortable with. Most binary options brokers require a minimum of $200 to start trading. The next step is to enter your financial information of how you will be making your payments or withdraws form your account. Many brokers accept payments by major credit cards, Paypal or wired transfer. Foreign binary options brokers have these payments plus other methods of payments recognized in their region of the world.
The final step involves sending proof of identification. At this point you are all set to start trading assets. But before you start trading do your research on the various assets and keep your eyes on the market news. Remember, the key to being profitable in binary options trading is to be discipline and rational and consistent in your decision making process. Make some rules for yourself and stick to them. One important to follow, invest only 5% of your total investment at a time for each trade. For someone starting with a $200 initial deposit amount that amount is $10. Just go slow and be patient. You will start seeing the profits coming into your account on a regular basis.
What are Assets?
Trading in binary options centers around what the price of various assets are doing on the global market and the purchaser is simply trying to predict the outcome of price of the assets. Will the price of trhe asset go up or down in a specified timeframe. In binary options trading there are four types of assets: currency pair, stocks, indices and commodities.
Currency or binary option are the most popular traded assets in binary options trading. Currency pair is the exchange rate or quoted price between two currencies. This quote will lfuctuates from day to day. The first currency in the pair is called the "base currency" and the second currency in the pair is called the "quote currency". For example, currency pairs are usually denoted in a format similar to this one. The the EUR/USD currency pair. This is the popular EURO - U.S. Dollar currency pair weitten in the International Standard Organization (ISO) format. The value of the first or base currency is always one or one unit of that currency. The value of the second currency is the exchange rate or how many units equals the base currency. For example, a quote of EUR/USD 1.0950 means that one EURO is equal to $1.10.
The USD currency paired with another currency are generally the mos popylar of the currency pairs traded since the US economy is one the largest and strongest in the world market. Other commonly traded curriencies are the Euro, New Zealand dollar, the Canadian dollar, the Sqiss Franc, the British pound, the Japanese yen and the Australian dollar.
Stocks are the most familiar form of trading in both Forex and binary options trading. They are less riskier jam trading in the Forex because you do not buy and hold stocks in binary options trading. The purchaser just perfect whether the stock the price of a particular company will be up or down after a specified timeframe, usually a day, week, month or even a year. These are short term predictions.
Indices are a composed of a group of companies where the price of the indices are based on the average price of assets in the group. Examples of indices are the Standard & Poor's 500 and DJ Wilshire 500.
Commodities are raw material or agricultural products brought and sold in the world market. Gold, silver, platinum and crude oil are typical raw materials. Sugar and whiter examples of agricultural products brought and sold in the market. The price of commodities are the supply and demand for these products in the world. Sometimes their prices are affected by major events in the world.
As you can see, binary options traders have a variety of assets or instruments to predict the price outcome to make a profit.
Indices are a composed of a group of companies where the price of the indices are based on the average price of assets in the group. Examples of indices are the Standard & Poor's 500 and DJ Wilshire 500.
Commodities are raw material or agricultural products brought and sold in the world market. Gold, silver, platinum and crude oil are typical raw materials. Sugar and whiter examples of agricultural products brought and sold in the market. The price of commodities are the supply and demand for these products in the world. Sometimes their prices are affected by major events in the world.
As you can see, binary options traders have a variety of assets or instruments to predict the price outcome to make a profit.
Subscribe to:
Posts (Atom)
